In any business, data is critical. On its basis conclusions can be drawn, and it becomes a pretext for making changes in the operation of the company. For Shopify online shops, reports are also important. How to use them wisely?
Reports in Shopify
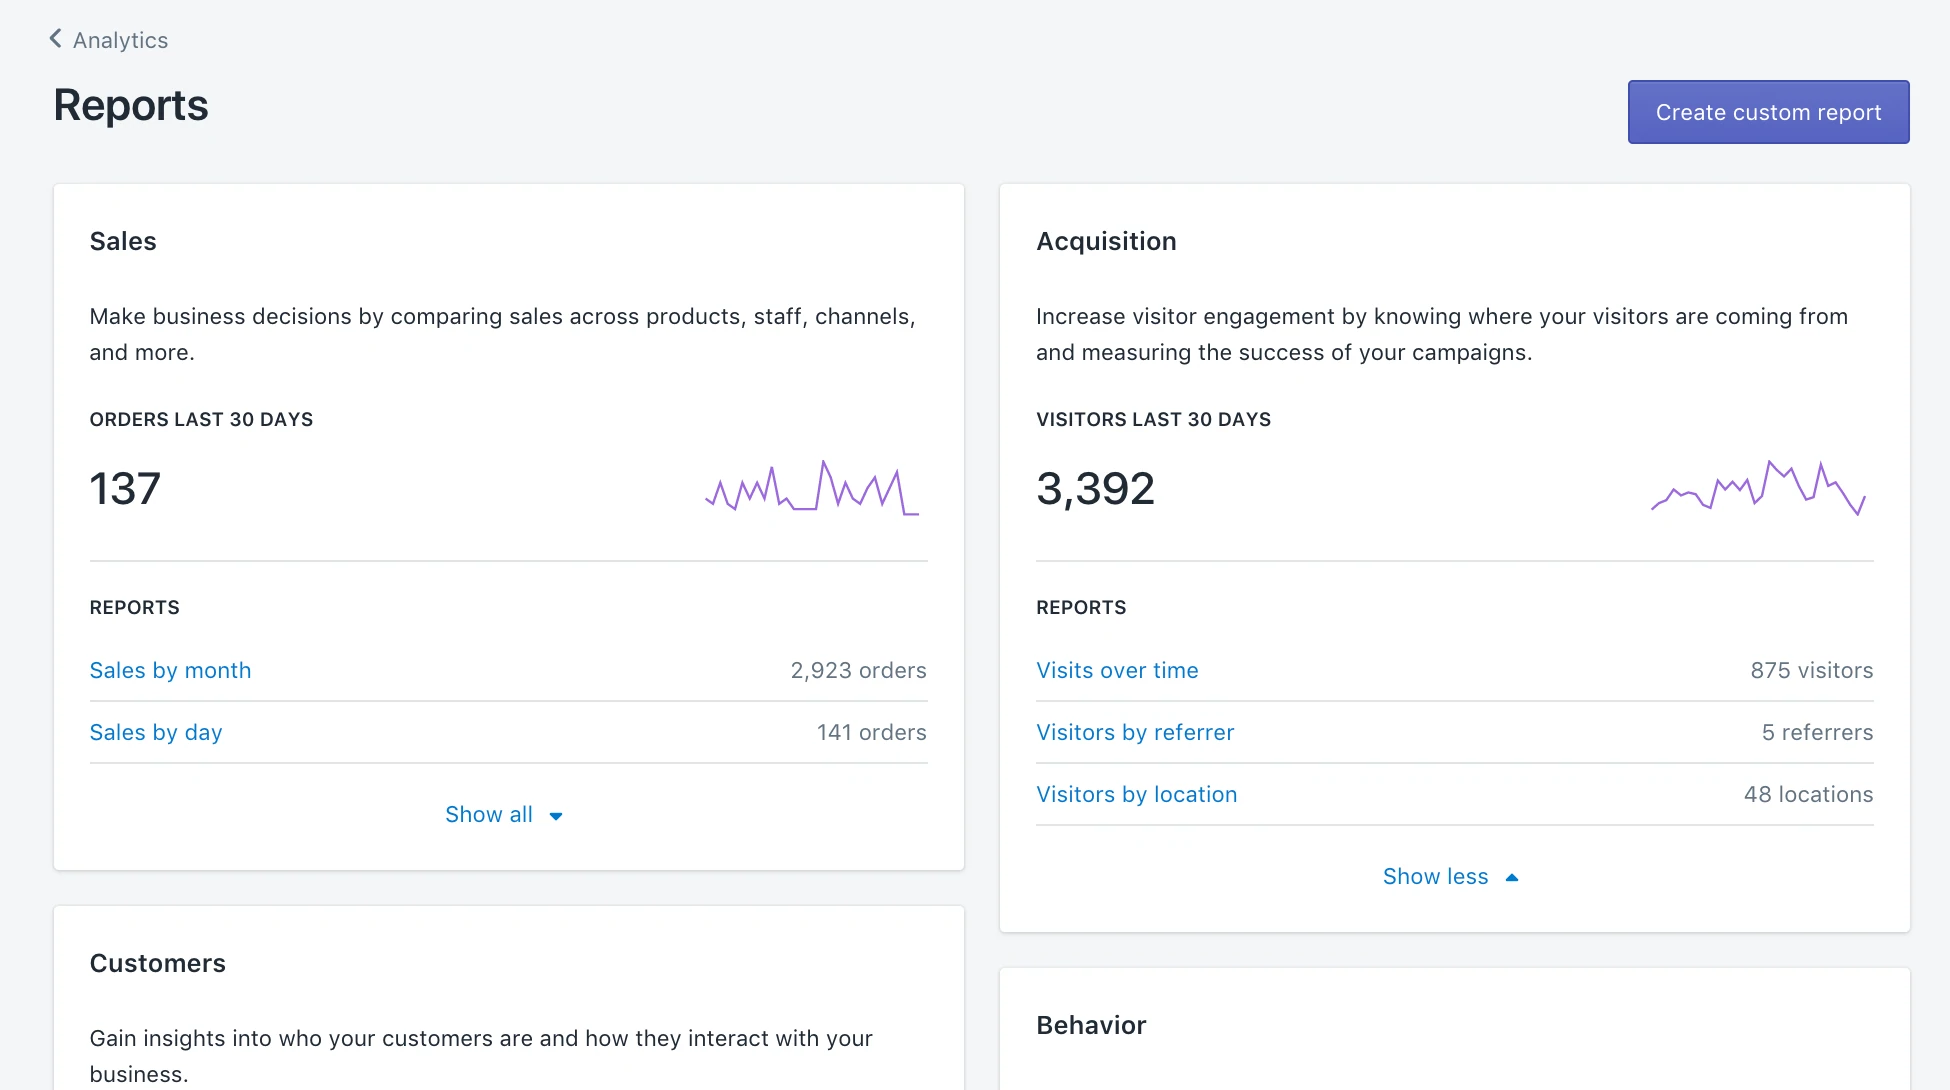
In order to be able to analyze the functioning, including the effects of a Shopify store, the platform developers offer sellers the possibility to generate reports. What they include varies depending on the plan you selected during enrollment. In the main menu, sellers can find Shopify sales reports. They are categorized based on the information they display. Depending on the plan you choose on Shopify, different types of reports are available. The higher the subscription plan, the more data is available to us.
In the Basic plan, you get all the necessary analytical reports – financials, products, customer acquisition, inventory, user behavior, marketing reports.
The medium (Shopify) plan additionally offers reports on orders, sales, retail sales (if using POS Shopify), a profit report, and a super useful customer report (e.g., number of customers by time, sales amount with new vs returning customers, customers by location).
With the Advanced and Shopify Plus plan, you get 2 additional customer reports (at-risk customers, loyal customers) as well as the ability to build your own reports. Reporting in Shopify is convenient and for many users will be enough to make good decisions.
You can view and sort data from your store on Shopify by selecting a convenient time period. In addition, it can also be compared to another segment of time.
source: https://www.shopify.com/blog/analyzing-shopify-reports
Online store analytics on Shopify
In the Shopify dashboard, the Analytics tab displays key data on sales, orders, and online store visitors. The dashboard presents key metrics that affect both e-commerce performance and consumer behavior. Depending on your needs and preferences, you can see the data in graphs or numerical form. And what might they represent? On the analytics dashboard (analytics summary) we will find all the most important e-commerce metrics:
- average order value,
- conversion rate,
- online store sessions by device type, location, traffic source, social source,
- rate of returning customers,
- sales by POS location, social source, employees, traffic source,
- best sites, products,
- a total number of online store sessions, total orders, total sales, and highlighted those made through marketing.
Such data is the basis for analysis. By knowing what your profits are, where your customers are coming from, how many of them decide to buy, what the average value of their shopping cart is, and how many of them come back to the store again, you can successfully make conclusions that will help you make better business decisions.
source: https://www.shopify.com/blog/analyzing-shopify-reports
How to use Shopify Analytics wisely?
Reviewing your Shopify store analytics should serve to better understand whether you’re getting the most out of the platform for online store owners and whether there’s any way you can still improve. However, data alone will not help with this. You still need to know how to use it wisely.
With Shopify Analytics, you can impact sales growth. This is because you get to know the traffic sources from which customers are coming. This will help you figure out where to run your paid advertising. Analyses also show which products sell best, and therefore which have the greatest potential – bestsellers can be used, for example, in upselling activities.
Customer loyalty information can be used to build customer segments and offer them attractive discounts, discount codes, or participation in a loyalty program.
Marketing channel performance data to optimize expenses – it may be more cost-effective to shift all marketing expenses to the best-performing campaigns.
A report on the most frequently searched phrases in your store may allow you to plan better category tree (product discoverability), banner ads, content actions.
A report on products frequently bought together can be used to help you build sets of products at discounted prices.
Professional reports that Shopify offers are a source of potential insight to help you improve your business. It is a good practice to make a habit of periodically reviewing key analytics reports and planning optimization activities.
Get started using analytics on Shopify
It’s worth using the Shopify reports and analytics that the platform provides. Over time, it becomes much easier than it was at first, and it is a treasure trove of knowledge. By analyzing your data, you can not only optimize your store for sales, but also for UX to fully fit your customers’ needs. If you have questions about analytics and reporting on Shopify, please contact us via the form below or message us on Facebook or Instagram – we’d love to answer any questions you have.
WeCanFly